Conduct informatics analysis and visualization applied to different real-world fields, such as health science and privacy
Introduction
Nearly 2.5 quintillion bytes of data are produced by Internet users every day, making big data an extremely valuable commodity for many different industries (Petrov, 2020). Analyzing data can provide insights into user behavior and trends, and informatics professionals will often conduct informatics analyses on big data sources to extract these insights. Data analysis is useful in a wide variety of fields and creating data visualizations is an excellent way to make large data sets easier to understand (Heitzman, 2019).
Coursework Overview
I’ve had the opportunity to learn about different data analytics techniques in this program and apply these analyses to real-world data sets in the health science field. In INFM 213, I learned how to process epidemiology data sets, write analytical code, and apply statistical operations to the results using an analytics software called SAS. During this course, I created a project that used data from the National Health and Nutrition Examination Survey (NHANES) to determine the relationship between diabetes and depression. I processed the data in SAS and wrote my own code in the SAS programming language to analyze the dataset. In INFM 203, I learned how to wrangle and process large datasets using both Python and Hadoop. My project for this course used datasets from the California Health and Human Services Open Data Portal (CHHS) to determine possible patterns in kindergarten immunizations throughout the state. I used Python and Jupyter notebook to process the data, record my findings, and created a presentation to discuss my results with my classmates. Both of these projects helped me better understand how to conduct informatics analyses on datasets and create visualizations to summarize the results.
Evidence 1
INFM 213 Project: Using epidemiological methods to determine statistical relationships in datasets.
View ProjectEvidence 2
INFM 203 Project and Discussion: Exploring big data sets with Jupyter Notebook and Python.
View Project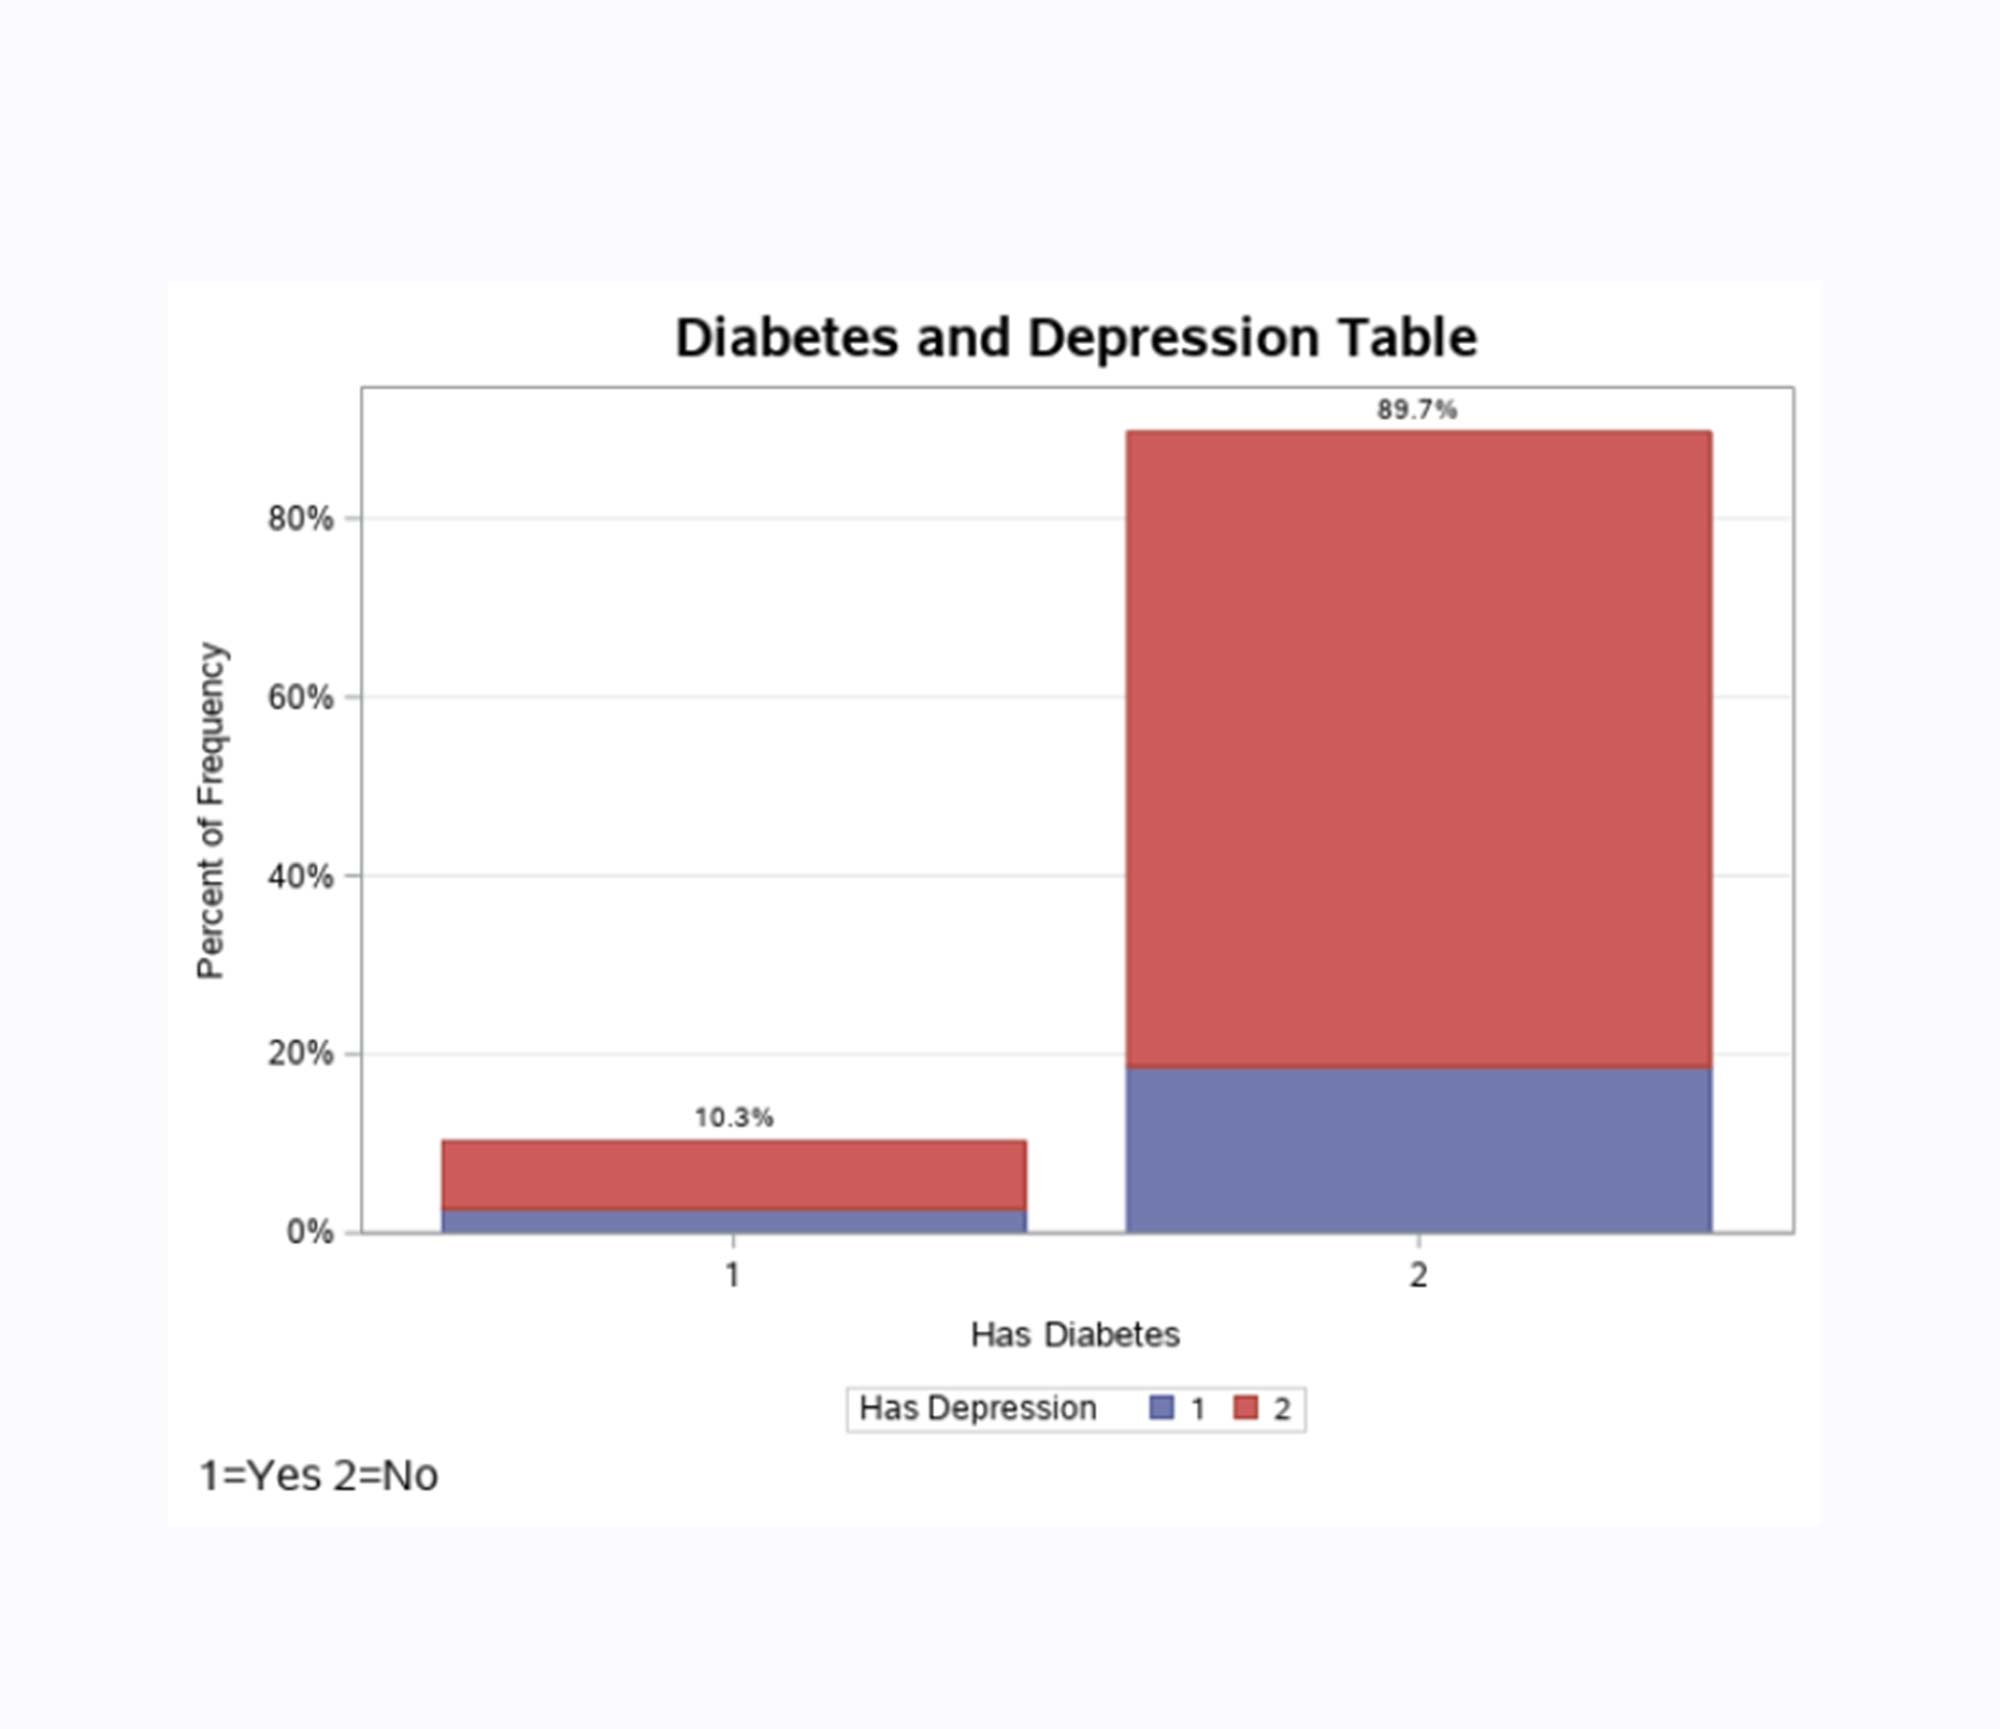
A table generated from the NHANES dataset showing the relationship between diabetes and depression
Evidence 1: Using epidemiological methods to determine statistical relationships in datasets.
Information professionals often use statistical software and programming to process raw datasets, isolate relevant data, and reveal patterns and relationships in datasets. In INFM 213, I created an epidemiology project that used the NHANES dataset to determine the relationship between diabetes and depression. In order to process the data, I used SAS to import the dataset and used the SAS language to define and analyze different variables. After removing missing information and isolating the diabetes and depression data, I wrote SAS code that applied epidemiology formulas to new variables and analyzed them using different statistical techniques. Following this, I created data visualizations to clearly summarize the relationship between diabetes and depression. The results yielded that individuals who are diabetic have increased odds of developing depression compared to those without diabetes. At the end of my project, I recommended that health professionals should consider screening diabetes patients for depression and offer counseling or medication to patients who develop depression. This experience helped me learn how to apply epidemiological analysis techniques to determine the relationship between variables in a dataset using real-world data from the health science field.
Evidence 2: Exploring big data sets with Jupyter Notebook and Python.
Data analysis has become incredibly important in the health science field and can help determine trends in population health and detect disease outbreaks (Petrov, 2020). In order to make big data usable and understandable, informaticists must understand how to process, analyze, and summarize large datasets. In INFM 203, I learned how to use Python and Hadoop to analyze data. For this course, I created a project that used data from the CHHS Open Data Portal to explore the data analysis process. I chose to use a CHHS dataset called “School Immunizations in Kindergarten by Academic Year” for the state of California, and focused on mapping the raw data, cleaning it, and recording a preliminary analysis of any patterns or trends I noticed. I recorded my process in Jupyter Notebook and used Python to import, isolate, and observe any patterns in the data. The main goal of this project was to practice the data analysis process and observe patterns or trends in the data without drawing any conclusions. Although I did not draw any conclusions about the dataset, I noticed some trends that suggested that private and charter schools in California may have lower vaccination rates than public schools. After finishing this process, I created a PowerPoint presentation and shared my project in a discussion post with my classmates. I received good feedback from my classmates during this discussion and also answered questions about my dataset and process. Many of my classmates had diverse and interesting projects, and I enjoyed their presentations and learning about their data analysis process.
Conclusion
Big data is growing quickly due to advances in technology and has become a valuable commodity for many different industries. In order to make data useful, information professionals must understand how to analyze large data sets and summarize their findings through visualizations. Many different fields use information analysis to better understand their users’ behaviors and capture patterns and trends in the data. The health science field has harnessed data analysis for a wide variety of uses, including public health research, early disease detection, and population health trends. In INFM 213, I created an epidemiology project that analyzed the NHANES dataset with statistical methods to find the relationship between diabetes and depression. Additionally, I summarized my findings using data visualizations, which made the large dataset easier to understand. I also learned about the information analysis process in INFM 203 and used a dataset in the CHHS Open Data Portal to find patterns in kindergarten vaccination in the state of California. Both of these projects taught me how to analyze data in different ways, and I also learned how to use two different programming languages to process the data. These experiences have helped me expand my knowledge about the process and benefits of data analysis and will help me create better solutions for users in the future.
References
Heitzman, A. (2019, January 29). Data Visualization: What It Is, Why It’s Important & How to Use It for SEO. Search Engine Journal. https://www.searchenginejournal.com/what-is-data-visualization-why-important-seo/288127/#close
Petrov, C. (2020, September 10). 25+ Impressive Big Data Statistics for 2020. TechJury. https://techjury.net/blog/big-data-statistics/#gref